Futures Fighter MO: Multi-Confluence Day Trading System ADX/SMI👋 Strategy Overview: The Multi-Confluence Mashup
The Futures Fighter MO is a comprehensive, multi-layered day trading strategy designed for experienced traders focusing on high-liquidity futures contracts (e.g., NQ, ES, R2K).
This strategy is a sophisticated mashup that uses the 1-minute chart for surgical entries while enforcing strict environmental filtering through higher-timeframe data. We aim to capture high-conviction moves only when multiple, uncorrelated signals align.
🧠 How the Logic Works (Concepts & Confluence)
Our logic is built on four pillars, which must align for a trade to be executed:
Primary Trend Filter
Indicators :
ADX/DMI (15-Minute Lookback)
Role :
Price action is filtered to ensure the ADX (17/14) is above 25, confirming a strong, prevailing market trend (Bullish or Bearish). Trades are strictly rejected during "Flat" (sideways) market regimes.
Entry Signal Types
The system uses multiple entry types:
- 🟢 Trend Long/Short: A breakout/rejection near the 200-Period EMA is confirmed by the primary ADX trend.
- 🔴 Engulfing Rejection: A strong signal when a Bullish/Bearish Engulfing or Doji prints near the long-term 500-Period EMA (emaGOD) while the Stochastic Momentum Index (SMI on 30M) is in an extreme overbought/oversold state (below $-40$ or above $40$).
Volatility & Volume Confirmation
Indicators: Average True Range (ATR) and 20-Period SMA of Volume
Role: Every entry requires a volume spike (Current Volume $> 1.5 \times$ SMA Volume) to confirm that the move is supported by significant liquidity. Volatility is tracked via ATR to define bar range and stop boundaries.
Structural Guardrails
Indicators: Daily Pivot Points (PP, S1-S3, R1-R3)
Role: Trades are disabled if the current bar's price range intersects with a Daily Pivot Point. This is a critical filter to avoid high-chop consolidation zones near key structural levels.
📊 Strategy Results & Required Disclosures
I strive to publish backtesting results that are transparent and realistic for the retail futures trader.
- Initial Capital: $50,000 - A realistic base for Mini/Micro futures contracts.
- Order Size: 1 Contract (Pyramiding up to 3) - Conservative risk relative to the account size.
- Commission: $0.11 USD per order - Represents realistic costs for low-cost brokers.
- Slippage: 2 Ticks - Accounts for expected market friction.
⚠️ Risk Management & Deviations
Stop-Loss: The strategy uses a dynamic stop-loss system where positions are closed upon a reversal (e.g., breaking the 50-Period EMA or failure to hold a Pivot Point), rather than a fixed tick-based stop. This is suited for experienced traders using a low relative risk (single Micro-contract entry) on a larger account. Users must confirm that the first entry's maximum potential loss remains below $10\%$ of their capital for compliance.
Trade Sample Size: Due to data limitations of the TradingView Essential plan (showing $\approx 50$ trades over 2 weeks), the sample size is under the ideal $100+$ target. Justification: This system is designed to generate signals across a portfolio of correlated futures markets (NQ, ES, R2K, Gold, Crude), meaning the real sample size for a user tracking the portfolio is significantly higher.
Drawdown Control: This strategy is designed for manual management. It requires the user to turn the script/alerts OFF after a significant drawdown and only reactivate it once a recovery trend is established externally.
The strategy uses a combination of dynamic trailing stops, structural support/resistance zones, and a fixed profit target to manage open positions.
🛑 Strategy Exit Logic
1. General Stop-Loss (Dynamic Trailing Stop)
These conditions act as the primary dynamic stop, closing the position if the market reverses past a key Moving Average (MA):
- Long Positions Closed When: The current bar's close crosses under the 50-Period EMA (emaLong).
- Short Positions Closed When: The current bar's close crosses above the 50-Period EMA (emaLong).
2. Profit Target (Fixed Percentage)
The script includes a general exit based on a user-defined profit percentage:
Take Profit Trigger: The position is closed when the currentProfitPercent meets or exceeds the input Profit Target (%) (default is 1.0% of the entry price).
3. Structural Exits (Daily Pivot Points)
These exits are high-priority, "close all" orders that trigger when the price fails to hold or reclaims a recent Daily Pivot Point, suggesting a failure of the current move.
- VR Close All - Long ($\sym{size} > 0$) - Price crosses under a Daily Resistance Level (R1, R2, or R3) minus 1 ATR within the last 10 bars. This indicates the current momentum failed to hold Resistance as support.
- VS Close All - Short ($\sym{size} < 0$) - Price crosses above a Daily Support Level (S1, S2, or S3) plus 1 ATR within the last 10 bars. This indicates the current momentum failed to hold Support as resistance.
4. Trend Failure Exit (Trend-Following Signals Only)
This exit protects against holding a position when the primary high-timeframe trend used for the entry has failed:
- Long Positions Closed When: The primary trend is no longer "bullish" for more than 2 consecutive bars (i.e., it turned "bearish" or "flat").
- Short Positions Closed When: The primary trend is no longer "bearish" for more than 2 consecutive bars (i.e., it turned "bullish" or "flat").
5. End of Day (EOD) Session Control
The final hard exits based on time:
- End of Session (EoS): At 11:30 AM, new trades are disabled (TradingDay := false). Open positions are kept.
- End of Day (EoD): At 1:30 PM, all remaining open positions are closed (strategy.close_all).
🤝 Development & Disclaimer
This script and description were created with assistance from Gemini and GitHub Copilot. My focus is on helping fellow real estate investors and day traders develop mechanically sound systems.
Disclaimer: This is for educational purposes only and does not constitute financial advice. Always abide by the Realtor Code and manage your own risk.
Pesquisar nos scripts por "take profit"

NY VIX Channel Trend US Futures Day Trade StrategyNY VIX Channel Trend Strategy
Summary in one paragraph
Session anchored intraday strategy for index futures such as ES and NQ on one to fifteen minute charts. It acts only after the first configurable window of New York Regular Trading Hours and uses a VIX derived daily implied move to form a realistic channel from the session open. Originality comes from using a pure implied volatility yardstick as portable support and resistance, then committing in the direction of the first window close relative to the open. Add it to a clean chart and trade the simple visuals. For conservative alerts use on bar close.
Scope and intent
• Markets. Index futures ES and NQ
• Timeframes. One to thirty minutes
• Default demo. ES1 on five minutes
• Purpose. Provide a portable intraday yardstick for entries and exits without curve fitting
• Limits. This is a strategy. Orders are simulated on standard candles
Originality and usefulness
• Unique concept. A VIX only channel anchored at 09:30 New York plus a single window trend test
• Addresses. False urgency at session open and unrealistic bands from arbitrary multipliers
• Testability. Every input is visible and the channel is plotted so users can audit behavior
• Portable yardstick. Daily implied move equals VIX percent divided by square root of two hundred fifty two
• Protected status. None. Method and use are fully disclosed
Method overview in plain language
Take the daily VIX or VIX9D value, convert it to a daily fraction by dividing by square root of two hundred fifty two, then anchor a symmetric channel at the New York session open. Observe the first N minutes. If that window closes above the open the bias is long. If it closes below the open the bias is short. One trade per session. Exits occur at the channel boundary or at a bracket based on a user selected VIX factor. Positions are closed a set number of minutes before the session ends.
Base measures
Return basis. The daily implied move unit equals VIX percent divided by square root of two hundred fifty two and serves as the distance unit for targets and stops.
Components
• VIX Channel. Top, mid, bottom lines anchored at 09:30 New York. No extra multipliers
• Window Trend. Close of the first N minutes relative to the session open sets direction
• Risk Bracket. Take profit and stop loss equal to VIX unit times user factor
• Session Window. Uses the exchange time of the chart
Fusion rule
Minimum gates count equals one. The trade only arms after the window has elapsed and a direction exists. One entry per session.
Signal rule
• Long when the window close is above the session open and the window has completed
• Short when the window close is below the session open and the window has completed
• Exit on channel touch. Long exits at the top. Short exits at the bottom
• Flat thirty minutes before the session close or at the user setting
Inputs with guidance
Setup
• Use VIX9D. Width source. Typical true for fast tone or false for baseline
• Use daily OPEN. Toggle for sensitivity to overnight changes
Logic
• Window minutes. Five to one hundred twenty. Larger values delay entries and reduce whipsaw
• VIX factor for TP. Zero point five to two. Raising it widens the profit target
• VIX factor for SL. Zero point five to two. Raising it widens the stop
• Exit minutes before close. Fifteen to ninety. Raising it exits earlier
Properties visible in this publication
• Initial capital one hundred thousand USD
• Base currency USD
• request.security uses lookahead off
• Commission cash per contract two point five $ per each contract. Slippage one tick
• Default order size method FIXED with value one contract. Pyramiding zero. Process orders on close ON. Bar magnifier OFF. Recalculate after order is filled OFF. Calc on every tick ON
Realism and responsible publication
No performance claims. Past results never guarantee future outcomes. Fills and slippage vary by venue. Shapes can move while a bar forms and settle on close. Strategy uses standard candles.
Honest limitations and failure modes
Economic releases and thin liquidity can break the channel. Very quiet regimes can reduce signal contrast. Session windows follow the exchange time of the chart. If both stop and target can be hit within one bar, assume stop first for conservative reading without bar magnifier.
Works best in liquid hours of New York RTH. Very large gaps and surprise news may exceed the implied channel. Always validate on the symbols you trade.
Entries and exits
• Entry logic. After the first window, go long if the window close is above the session open, go short if below
• Exit logic. Long exits at the channel top or at the take profit or stop. Short exits at the channel bottom or at the take profit or stop. Flat before session close by the configured minutes
• Risk model. Initial stop and target based on the VIX unit times user factors. No trail and no break even. No cooldown
• Tie handling. Treat as stop first for conservative interpretation
Position sizing
Fixed size one contract per trade. Target risk per trade should generally remain near one percent of account equity. Risk is based on the daily volatility value, the max loss from the tests for one year duration with 5min chart was 4%, while the avg loss was below <1% of the total capital.
If you have any questions please let me know. Thank you for coming by !

Enhanced MA Crossover Pro📝 Strategy Summary: Enhanced MA Crossover Pro
This strategy is an advanced, highly configurable moving average (MA) crossover system designed for algorithmic trading. It uses the crossover of two customizable MAs (a "Fast" MA 1 and a "Slow" MA 2) as its core entry signal, but aggressively integrates multiple technical filters, time controls, and dynamic position management to create a robust and comprehensive trading system.
💡 Core Logic
Entry Signal: A bullish crossover (MA1 > MA2) generates a Long signal, and a bearish crossover (MA1 < MA2) generates a Short signal. Users can opt to use MA crossovers from a Higher Timeframe (HTF) for the entry signal.
Confirmation/Filters: The basic MA cross signal is filtered by several optional indicators (see Filters section below) to ensure trades align with a broader trend or momentum context.
Position Management: Trades are managed with a sophisticated system of Stop Loss, Take Profit, Trailing Stops, and Breakeven stops that can be fixed, ATR-based, or dynamically adjusted.
Risk Management: Daily limits are enforced for maximum profit/loss and maximum trades per day.
⚙️ Key Features and Customization
1. Moving Averages
Primary MAs (MA1 & MA2): Highly configurable lengths (default 8 & 20) and types: EMA, WMA, SMA, or SMMA/RMA.
Higher Timeframe (HTF) MAs: Optional MAs calculated on a user-defined resolution (e.g., "60" for 1-hour) for use as an entry signal or as a trend confirmation filter.
2. Multi-Filter System
The entry signal can be filtered by the following optional conditions:
SMA Filter: Price must be above a 200-period SMA for long trades, and below it for short trades.
VWAP Filter: Price must be above VWAP for long trades, and below it for short trades.
RSI Filter: Long trades are blocked if RSI is overbought (default 70); short trades are blocked if RSI is oversold (default 30).
MACD Filter: Requires the MACD Line to be above the Signal Line for long trades (and vice versa for short trades).
HTF Confirmation: Requires the HTF MA1 to be above HTF MA2 for long entries (and vice versa).
3. Dynamic Stop and Target Management (S/L & T/P)
The strategy provides extensive control over exits:
Stop Loss Methods:
Fixed: Fixed tick amount.
ATR: Based on a multiple of the Average True Range (ATR).
Capped ATR: ATR stop limited by a maximum fixed tick amount.
Exit on Close Cross MA: Position is closed if the price crosses back over the chosen MA (MA1 or MA2).
Breakeven Stop: A stop can be moved to the entry price once a trigger distance (fixed ticks or Adaptive Breakeven based on ATR%) is reached.
Trailing Stop: Can be fixed or ATR-based, with an optional feature to auto-tighten the trailing multiplier after the breakeven condition is met.
Profit Target: Can be a fixed tick amount or a dynamic target based on an ATR multiplier.
4. Time and Session Control
Trading Session: Trades are only taken between defined Start/End Hours and Minutes (e.g., 9:30 to 16:00).
Forced Close: All open positions are closed near the end of the session (e.g., 15:45).
Trading Days: Allows specific days of the week to be enabled or disabled for trading.
5. Risk and Position Limits
Daily Profit/Loss Limits: The strategy tracks daily realized and unrealized PnL in ticks and will close all positions and block new entries if the user-defined maximum profit or maximum loss is hit.
Max Trades Per Day: Limits the number of executed trades in a single day.
🎨 Outputs and Alerts
Plots: Plots the MA1, MA2, SMA, VWAP, and HTF MAs (if enabled) on the chart.
Shapes: Plots visual markers (BUY/SELL labels) on the bar where the MA crossover occurs.
Trailing Stop: Plots the dynamic trailing stop level when a position is open.
Alerts: Generates JSON-formatted alerts for entry ({"action":"buy", "price":...}) and exit ({"action":"exit", "position":"long", "price":...}).

Gold 15m: Trend + S/R + Liquidity Sweep (RR 1:2)This strategy is designed for short-term trading on XAUUSD (Gold) using the 15-minute timeframe. It combines trend direction, support/resistance pivots, liquidity sweep detection, and momentum confirmation to identify high-probability reversal setups in line with the dominant market trend.
⚙️ Core Logic:
Trend Filter (EMA 200):
The strategy only takes long positions when price is above the 200 EMA and short positions when price is below it.
Support/Resistance via Pivots:
Dynamic swing highs and lows are identified using pivot points. These act as local supply and demand levels where liquidity is likely to accumulate.
Liquidity Sweep Detection:
A bullish liquidity sweep occurs when price briefly breaks below the last pivot low (grabbing liquidity) and then closes back above it.
A bearish sweep occurs when price breaks above the last pivot high and then closes back below.
Momentum & Candle Strength:
The strategy filters signals based on candle range and body size to ensure entries occur during strong price reactions, not weak retracements.
Risk Management (1:2 RR):
Stop-loss is placed slightly beyond the last pivot level using ATR-based buffers, and take-profit is set at 2× the risk distance, maintaining a reward-to-risk ratio of 1:2.
💼 Trade Logic Summary:
Long Entry:
After a bullish liquidity sweep & reclaim, momentum confirmation, and trend alignment (above EMA 200).
Short Entry:
After a bearish sweep & reclaim, momentum confirmation, and trend alignment (below EMA 200).
Exit:
Automated via ATR-based Stop Loss and Take Profit targets.
📊 Customization Options:
Adjustable EMA length, pivot settings, ATR multipliers, and RR ratio.
Option to enable/disable trend filter.
Toggle display of S/R zones on chart.
🧠 Best Use:
Works best during London and New York sessions when Gold shows strong momentum.
Can be adapted for forex pairs and indices by tuning ATR and pivot parameters.

VWAP & Band Cross Strategy v6 - AdvancedThese are a few updates made to the original script. The daily take profit and stop loss functions correctly for 1 contract but because of the pyramiding input even if not used you'll need to multiply the values by the number of contracts to keep consistent results. I have been unable to correct that function. Let me know if you test the script and have any recommendations for improvement. If trading an actual account I do recommend setting hard daily limits with your provider because there is still slippage from the original exit alerts even with the daily stop loss in place.
1. Real-Time Execution & Hard PnL Limits (The Focus)
The most critical changes were implemented to ensure the daily profit and loss limits act as hard, real-time barriers instead of waiting for the candle to close.
• Intrabar Tick Execution: The parameter calc_on_every_tick=true was added to the strategy() declaration. This forces the entire script to re-evaluate its logic on every single price update (tick), enabling immediate action.
• Real-Time PnL Tracking: The PnL calculation was updated to track the total_daily_pnl by summing the realized profit/loss (from closed trades) and the unrealized profit/loss (strategy.openprofit) on every tick.
• Immediate Closure: The script now checks the total_daily_pnl against the user-defined limits (daily_take_profit_value, daily_stop_loss_value) and immediately executes strategy.close_all() the moment the threshold is breached, preventing further trading.
• Combined Risk Enforcement: The user-defined "Max Intraday Risk ($)" and the "Daily Stop Loss (Value)" are compared, and the script enforces the tighter of the two limits.
2. Visibility and External Alerting
To address the unavoidable issue of slippage (which causes price overshoot in fast markets even with tick execution), dedicated alert mechanisms were added.
• Dedicated Alert Condition: An alertcondition named DAILY PNL LIMIT REACHED was added. This allows you to set up a TradingView alert that triggers the instant the daily_limit_reached variable turns true, giving you the fastest possible notification.
• Visual Marker: A large red triangle (\u25b2) is plotted on the chart using plotchar at the exact moment the daily limit condition is met, providing a clear visual confirmation of the trigger bar.
3. Strategy Features and Input Flexibility
Several user-requested features were integrated to make the strategy more robust and customizable.
• Trailing Stop / Breakeven (TSL/BE): A new exit option, Fixed Ticks + TSL, was added, allowing you to set a fixed profit target while also deploying a trailing stop or breakeven level based on points/ticks gained.
• Multiple Exit Types: The exit strategy was expanded to include logic for several types: Fixed Ticks, ATR-based, Capped ATR-based, VWAP Cross, and Price/Band Crosses.
• Pyramiding Control: An input Max Pyramiding Entries was introduced to control how many positions the strategy can have open at the same time.
• Confirmation Logic Toggle: Added an input to choose how multiple confirmation indicators (RSI, SMMA, MACD) are combined: "AND" (all must be true) or "OR" (at least one must be true).
• Indicator Confirmations: Logic for three external indicators—RSI, SMMA (EMA), and MACD—was fully integrated to act as optional filters for entry.
• VWAP Reset Anchors: Logic was corrected to properly reset the VWAP calculation based on the selected period ("Daily", "Weekly", or "Session") by using Pine Script v6's required anchor series.
Trading Day Filters: Inputs were added to select which specific days of the week the strategy is allowed to trade.

ORBSMMAATRVOLREENTRY2Contracts📈 Opening Range Fibonacci Breakout (TradingView Strategy)
Overview:
The Opening Range Fibonacci Breakout strategy is designed to capture high-probability intraday moves by combining the power of the 15-minute opening range, trend confirmation via SMMA, and volume-based momentum filtering.
At the start of each trading session, the script automatically plots the Opening Range Box based on the first 15 minutes of price action — highlighting key intraday support and resistance levels.
How It Works:
Opening Range Setup
The first 15 minutes of the session define the range high and low.
A visual box marks this zone on the chart for easy reference.
Signal Generation
A Smoothed Moving Average (SMMA) with a user-defined period determines overall trend bias.
Candle volume is analyzed to confirm momentum strength.
Long Signal: Price breaks above the opening range high, SMMA trending up, and volume supports the move.
Short Signal: Price breaks below the opening range low, SMMA trending down, and volume supports the move.
Take Profit & Targets
Fibonacci extension levels are automatically plotted from the opening range.
These dynamic levels serve as structured Take Profit (TP) zones for partial or full exits.
Features:
✅ 15-Minute Opening Range Box
✅ Adjustable SMMA period
✅ Volume-based confirmation filter
✅ Automatic Fibonacci profit targets
✅ Visual Long/Short alerts & signals
Ideal For:
Scalpers and intraday traders who rely on early-session momentum, breakout confirmation, and precision exit targets.
Backtested for MNQ/NQ futures trading

VWAP & Band Cross Strategy v6VWAP & Band Cross Strategy v6: Script Summary
This Pine Script implements a highly flexible, multi-layered trading strategy centered around the Volume Weighted Average Price (VWAP) and its associated Standard Deviation Bands.
The strategy is designed to test various entry/exit models based on how the price interacts with the central VWAP line and the upper/lower volatility bands, with extensive risk management and confirmation filters.
1. Core Mechanics (VWAP & Bands)
VWAP Calculation: Calculates the VWAP based on a user-defined source (default is the close price).
Standard Deviation Bands: Creates upper and lower bands by calculating the standard deviation of the price (over 20 periods by default) and multiplying it by a user-defined Multiplier (default is 2.0). These bands dynamically expand and contract with volatility.
Plotting: The script clearly plots the VWAP (purple), the Upper Band (green), and the Lower Band (red), with a colored fill between the bands.
2. Entry Triggers
The core entry logic is based on a single, user-selected cross event between the price and the VWAP/Bands. The user can choose from six predefined entry types:
Entry Type Category
Entry Trigger (Long)
Entry Trigger (Short)
Mean Reversion
Price crosses over the Lower Band.
Price crosses under the Upper Band.
Trend Following
Price crosses over the Upper Band (Breakout).
Price crosses under the Lower Band (Breakout).
VWAP Cross
Price crosses over the VWAP.
Price crosses under the VWAP.
3. Filters and Confirmation
Trades are only executed if they pass a series of optional filters, making the strategy highly customizable:
Technical Confirmation (Optional): Users can enable and configure up to three additional indicators that must align with the trade direction:
RSI: Price must be Oversold (for Long) or Overbought (for Short).
SMMA: Price must be above the SMMA (for Long) or below (for Short).
MACD: MACD line must cross the Signal line and the Histogram must be positive/negative.
Time and Day Filters: Trades are restricted to a defined Entry Start/End Hour/Minute window, and only execute on user-selected Trading Days of the week.
Trade Direction: Can be toggled to execute Long Only, Short Only, or Both.
4. Advanced Risk Management (Daily Limits)
The strategy incorporates robust daily limits that reset at a configured Daily Reset Hour/Minute:
Daily Profit/Loss Limits: If the running total of Realized PnL (closed trades) + Unrealized PnL (open position) exceeds a user-defined Daily Take Profit (in Ticks) or falls below the Daily Stop Loss (in Ticks), the strategy locks out new trades and immediately closes any open position.
Max Daily Trades: Prevents the strategy from entering more than a specified number of trades per day.
5. Exit Logic
The strategy exit is also highly configurable via the Exit Type setting:
Fixed Ticks / ATR / Capped ATR: If one of these is selected, the script calculates a static Stop Loss and Take Profit level upon entry, using either fixed tick values or dynamic values based on the Average True Range (ATR), which are then executed using Pine Script's strategy.exit function.
Cross Exits (VWAP/Bands): If selected, the position is closed when the price crosses the VWAP or a specific band in the opposite direction.
End-of-Day Close: An unconditional exit that closes all open positions at a user-defined Close All Hour/Minute, regardless of profit/loss or limit status, preventing positions from being held overnight.

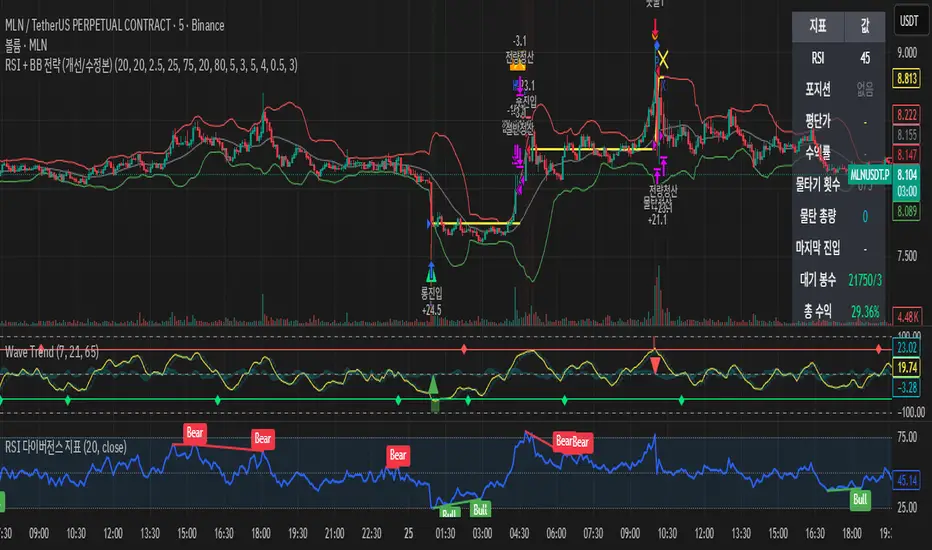
RSI + BB strategyBollinger Bands 20/2.5 + RSI 20-day 25/75
Long = Enter a long position when the price breaks below the Bollinger Band, the candlestick closes, and the RSI is below 25.
Short = Enter a short position when the price breaks above the Bollinger Band, the candlestick closes, and the RSI is above 75.
Take profit = Default setting: Take profit when profit is +4%. For safety, sell half of the position when profit is +2% to break even.
Lower average: -5% loss. If the RSI is 20/80, use the lower average. Sell the remaining amount when the price returns to its original price.
Based on 5-minute and 15-minute charts
Otherwise, signals will be difficult to obtain. For charts longer than 1 hour, adjust RSI and BB appropriately.
Amiya's Doji / Hammer / Spinning Top Breakout Strategy v5How it works
1. Pattern Detection (Previous Candle):
• Checks if total shadow length ≥ 2 × body.
• Checks if candle height (high − low) is between 10 and 21.5 points.
• If true → marks that candle as a potential Doji, Hammer, or Spinning Top.
2. Long Setup:
• LTP (close) crosses above previous candle high.
• Previous candle is a valid pattern candle.
• Stop Loss = 3 points below previous candle low.
• Take Profit = 5 × (high − low) of previous candle added to previous high.
3. Short Setup:
• LTP (close) crosses below previous candle low.
• Previous candle is a valid pattern candle.
• Stop Loss = 3 points above previous candle high.
• Take Profit = 5 × (high − low) of previous candle subtracted from previous low.
4. Visualization:
• Yellow background highlights pattern candles.
• Green ▲ and Red ▼ markers show entry points.
Deep yellow candles → represent Doji / Hammer / Spinning Top patterns
• Green triangle → Buy signal
• Red triangle → Sell signal
• Dotted green line + label → Target
• Dotted red line + label → Stop loss
• Gray background → Outside trading hours
• Auto close → All trades square off at 3:29 PM IST

U.T.M.S v2🇷🇺 ОПИСАНИЕ (РУССКИЙ)
U.T.M.S v2 — Чистый EMA-кроссовер с фильтрами
Стратегия для 15м (в первую очередь) и 1ч таймфреймов.
Генерирует сигналы при пересечении EMA(8) и EMA(19) только при подтверждении тренда, объёма, волатильности и времени суток.
Каждая сделка закрывается по фиксированному Take Profit и Stop Loss.
✅ Минимум ложных входов
✅ Работает только в ликвидные часы
✅ Полная фильтрация шума и флэта
🔧 Настройки:
Fast EMA / Slow EMA — периоды скользящих (по умолчанию 8 / 19)
Take Profit % — уровень фиксации прибыли (рек. 2.5%)
Stop Loss % — уровень стоп-лосса (рек. 2.0%)
Фильтры (все включены по умолчанию):
Use 1H Trend Filter — вход разрешён только по направлению тренда на 1H (EMA50 > EMA200 для лонга)
Use Volume Filter — объём должен быть ≥ 1.5× среднего за 20 баров
Min Volume Multiplier — нижний порог объёма (рек. 1.5)
Max Volume Multiplier — верхний порог (рек. 3.0–4.0), отсекает аномальные пампы
Use ATR Volatility Filter — минимальная волатильность (рек. 0.3%)
Use Time Filter (UTC) — торговля только в часы высокой ликвидности: 12:00–18:00 и 20:00–02:00 UTC
💡 Идеальна для ручной торговли или подключения сигнальных ботов.
🇬🇧 DESCRIPTION (ENGLISH)
U.T.M.S v2 — Clean EMA Crossover with Filters
Strategy for 15m (primarily) and 1h timeframes.
Generates signals when the EMA(8) and EMA(19) cross, only if trend, volume, volatility, and time of day are confirmed.
Each trade is closed with a fixed Take Profit and Stop Loss.
✅ Low noise, high-quality signals
✅ Active only during high-liquidity hours
✅ Fully protected against flat and fakeouts
🔧 Inputs:
Fast EMA / Slow EMA — moving average periods (default: 8 / 19)
Take Profit % — profit target (suggested: 2.5%)
Stop Loss % — stop loss level (suggested: 2.0%)
Filters (all enabled by default):
Use 1H Trend Filter — trades only in 1H trend direction (EMA50 > EMA200 for long)
Use Volume Filter — volume must be ≥ 1.5× 20-bar average
Min Volume Multiplier — minimum volume threshold (suggested: 1.5)
Max Volume Multiplier — maximum volume cap (suggested: 3.0–4.0), filters out pumps/dumps
Use ATR Volatility Filter — minimum volatility (suggested: 0.3%)
Use Time Filter (UTC) — active only during high-liquidity sessions: 12:00–18:00 & 20:00–02:00 UTC
💡 Perfect for manual trading or webhook-based signal bots.

Hyper SAR Reactor Trend StrategyHyperSAR Reactor Adaptive PSAR Strategy
Summary
Adaptive Parabolic SAR strategy for liquid stocks, ETFs, futures, and crypto across intraday to daily timeframes. It acts only when an adaptive trail flips and confirmation gates agree. Originality comes from a logistic boost of the SAR acceleration using drift versus ATR, plus ATR hysteresis, inertia on the trail, and a bear-only gate for shorts. Add to a clean chart and run on bar close for conservative alerts.
Scope and intent
• Markets: large cap equities and ETFs, index futures, major FX, liquid crypto
• Timeframes: one minute to daily
• Default demo: BTC on 60 minute
• Purpose: faster yet calmer PSAR that resists chop and improves short discipline
• Limits: this is a strategy that places simulated orders on standard candles
Originality and usefulness
• Novel fusion: PSAR AF is boosted by a logistic function of normalized drift, trail is monotone with inertia, entries use ATR buffers and optional cooldown, shorts are allowed only in a bear bias
• Addresses false flips in low volatility and weak downtrends
• All controls are exposed in Inputs for testability
• Yardstick: ATR normalizes drift so settings port across symbols
• Open source. No links. No solicitation
Method overview
Components
• Adaptive AF: base step plus boost factor times logistic strength
• Trail inertia: one sided blend that keeps the SAR monotone
• Flip hysteresis: price must clear SAR by a buffer times ATR
• Volatility gate: ATR over its mean must exceed a ratio
• Bear bias for shorts: price below EMA of length 91 with negative slope window 54
• Cooldown bars optional after any entry
• Visual SAR smoothing is cosmetic and does not drive orders
Fusion rule
Entry requires the internal flip plus all enabled gates. No weighted scores.
Signal rule
• Long when trend flips up and close is above SAR plus buffer times ATR and gates pass
• Short when trend flips down and close is below SAR minus buffer times ATR and gates pass
• Exit uses SAR as stop and optional ATR take profit per side
Inputs with guidance
Reactor Engine
• Start AF 0.02. Lower slows new trends. Higher reacts quicker
• Max AF 1. Typical 0.2 to 1. Caps acceleration
• Base step 0.04. Typical 0.01 to 0.08. Raises speed in trends
• Strength window 18. Typical 10 to 40. Drift estimation window
• ATR length 16. Typical 10 to 30. Volatility unit
• Strength gain 4.5. Typical 2 to 6. Steepness of logistic
• Strength center 0.45. Typical 0.3 to 0.8. Midpoint of logistic
• Boost factor 0.03. Typical 0.01 to 0.08. Adds to step when strength rises
• AF smoothing 0.50. Typical 0.2 to 0.7. Adds inertia to AF growth
• Trail smoothing 0.35. Typical 0.15 to 0.45. Adds inertia to the trail
• Allow Long, Allow Short toggles
Trade Filters
• Flip confirm buffer ATR 0.50. Typical 0.2 to 0.8. Raise to cut flips
• Cooldown bars after entry 0. Typical 0 to 8. Blocks re entry for N bars
• Vol gate length 30 and Vol gate ratio 1. Raise ratio to trade only in active regimes
• Gate shorts by bear regime ON. Bear bias window 54 and Bias MA length 91 tune strictness
Risk
• TP long ATR 1.0. Set to zero to disable
• TP short ATR 0.0. Set to 0.8 to 1.2 for quicker shorts
Usage recipes
Intraday trend focus
Confirm buffer 0.35 to 0.5. Cooldown 2 to 4. Vol gate ratio 1.1. Shorts gated by bear regime.
Intraday mean reversion focus
Confirm buffer 0.6 to 0.8. Cooldown 4 to 6. Lower boost factor. Leave shorts gated.
Swing continuation
Strength window 24 to 34. ATR length 20 to 30. Confirm buffer 0.4 to 0.6. Use daily or four hour charts.
Properties visible in this publication
Initial capital 10000. Base currency USD. Order size Percent of equity 3. Pyramiding 0. Commission 0.05 percent. Slippage 5 ticks. Process orders on close OFF. Bar magnifier OFF. Recalculate after order filled OFF. Calc on every tick OFF. No security calls.
Realism and responsible publication
No performance claims. Past results never guarantee future outcomes. Shapes can move while a bar forms and settle on close. Strategies execute only on standard candles.
Honest limitations and failure modes
High impact events and thin books can void assumptions. Gap heavy symbols may prefer longer ATR. Very quiet regimes can reduce contrast and invite false flips.
Open source reuse and credits
Public domain building blocks used: PSAR concept and ATR. Implementation and fusion are original. No borrowed code from other authors.
Strategy notice
Orders are simulated on standard candles. No lookahead.
Entries and exits
Long: flip up plus ATR buffer and all gates true
Short: flip down plus ATR buffer and gates true with bear bias when enabled
Exit: SAR stop per side, optional ATR take profit, optional cooldown after entry
Tie handling: stop first if both stop and target could fill in one bar

TriAnchor Elastic Reversion US Market SPY and QQQ adaptedSummary in one paragraph
Mean-reversion strategy for liquid ETFs, index futures, large-cap equities, and major crypto on intraday to daily timeframes. It waits for three anchored VWAP stretches to become statistically extreme, aligns with bar-shape and breadth, and fades the move. Originality comes from fusing daily, weekly, and monthly AVWAP distances into a single ATR-normalized energy percentile, then gating with a robust Z-score and a session-safe gap filter.
Scope and intent
• Markets: SPY QQQ IWM NDX large caps liquid futures liquid crypto
• Timeframes: 5 min to 1 day
• Default demo: SPY on 60 min
• Purpose: fade stretched moves only when multi-anchor context and breadth agree
• Limits: strategy uses standard candles for signals and orders only
Originality and usefulness
• Unique fusion: tri-anchor AVWAP energy percentile plus robust Z of close plus shape-in-range gate plus breadth Z of SPY QQQ IWM
• Failure mode addressed: chasing extended moves and fading during index-wide thrusts
• Testability: each component is an input and visible in orders list via L and S tags
• Portable yardstick: distances are ATR-normalized so thresholds transfer across symbols
• Open source: method and implementation are disclosed for community review
Method overview in plain language
Base measures
• Range basis: ATR(length = atr_len) as the normalization unit
• Return basis: not used directly; we use rank statistics for stability
Components
• Tri-Anchor Energy: squared distances of price from daily, weekly, monthly AVWAPs, each divided by ATR, then summed and ranked to a percentile over base_len
• Robust Z of Close: median and MAD based Z to avoid outliers
• Shape Gate: position of close inside bar range to require capitulation for longs and exhaustion for shorts
• Breadth Gate: average robust Z of SPY QQQ IWM to avoid fading when the tape is one-sided
• Gap Shock: skip signals after large session gaps
Fusion rule
• All required gates must be true: Energy ≥ energy_trig_prc, |Robust Z| ≥ z_trig, Shape satisfied, Breadth confirmed, Gap filter clear
Signal rule
• Long: energy extreme, Z negative beyond threshold, close near bar low, breadth Z ≤ −breadth_z_ok
• Short: energy extreme, Z positive beyond threshold, close near bar high, breadth Z ≥ +breadth_z_ok
What you will see on the chart
• Standard strategy arrows for entries and exits
• Optional short-side brackets: ATR stop and ATR take profit if enabled
Inputs with guidance
Setup
• Base length: window for percentile ranks and medians. Typical 40 to 80. Longer smooths, shorter reacts.
• ATR length: normalization unit. Typical 10 to 20. Higher reduces noise.
• VWAP band stdev: volatility bands for anchors. Typical 2.0 to 4.0.
• Robust Z window: 40 to 100. Larger for stability.
• Robust Z entry magnitude: 1.2 to 2.2. Higher means stronger extremes only.
• Energy percentile trigger: 90 to 99.5. Higher limits signals to rare stretches.
• Bar close in range gate long: 0.05 to 0.25. Larger requires deeper capitulation for longs.
Regime and Breadth
• Use breadth gate: on when trading indices or broad ETFs.
• Breadth Z confirm magnitude: 0.8 to 1.8. Higher avoids fighting thrusts.
• Gap shock percent: 1.0 to 5.0. Larger allows more gaps to trade.
Risk — Short only
• Enable short SL TP: on to bracket shorts.
• Short ATR stop mult: 1.0 to 3.0.
• Short ATR take profit mult: 1.0 to 6.0.
Properties visible in this publication
• Initial capital: 25000USD
• Default order size: Percent of total equity 3%
• Pyramiding: 0
• Commission: 0.03 percent
• Slippage: 5 ticks
• Process orders on close: OFF
• Bar magnifier: OFF
• Recalculate after order is filled: OFF
• Calc on every tick: OFF
• request.security lookahead off where used
Realism and responsible publication
• No performance claims. Past results never guarantee future outcomes
• Fills and slippage vary by venue
• Shapes can move during bar formation and settle on close
• Standard candles only for strategies
Honest limitations and failure modes
• Economic releases or very thin liquidity can overwhelm mean-reversion logic
• Heavy gap regimes may require larger gap filter or TR-based tuning
• Very quiet regimes reduce signal contrast; extend windows or raise thresholds
Open source reuse and credits
• None
Strategy notice
Orders are simulated by TradingView on standard candles. request.security uses lookahead off where applicable. Non-standard charts are not supported for execution.
Entries and exits
• Entry logic: as in Signal rule above
• Exit logic: short side optional ATR stop and ATR take profit via brackets; long side closes on opposite setup
• Risk model: ATR-based brackets on shorts when enabled
• Tie handling: stop first when both could be touched inside one bar
Dataset and sample size
• Test across your visible history. For robust inference prefer 100 plus trades.

Master Trend Strategy - by jake_thebossMaster Trend Strategy
This strategy combines multiple technical indicators to identify high-probability trend entries across all asset classes.
Core Signal Logic:
Entry triggered when EMA 4 crosses above/below EMA 5
Confirmation required from RSI (>50 for long, <50 for short)
Price must be above/below key moving averages: EMA 21, SMA 50, EMA 55, EMA 89, and EMA 750
Additional confirmation from Stochastic (>52 bullish, <48 bearish) or EMA 89 breakout or VWAP cross
Key Features:
VWAP filter: Only takes bullish signals above VWAP and bearish signals below VWAP
Optional pyramiding: Allows multiple entries in the same direction (up to 200 orders)
Individual stop loss and take profit management for each pyramid level
Time filter: Customizable trading hours with timezone offset
Risk management: Adjustable stop loss (default 0.3%) and take profit (default 0.6%)
Visualization:
Entry, stop loss, and take profit levels drawn as horizontal lines
Customizable signal markers (triangles) for bull/bear entries
Optional EMA overlay display
The strategy is designed for trend-following on lower timeframes, with strict multi-indicator confirmation to filter out false signals.

AlgoWay GRSIM🧭 What this strategy tries to do
This strategy detects when a market move is losing strength and prepares for a potential reversal, but it waits for fresh momentum confirmation before acting.
It combines:
• RSI-based divergence (to spot exhaustion and potential turning points),
• Impulse MACD (to verify that the new direction actually has force behind it).
________________________________________
⚙️ When it takes trades
Long (Buy):
• A bullish RSI divergence appears (a clue that selling pressure is fading);
• Within a short time window, the Impulse MACD turns strongly positive;
• Optionally, the impulse line itself must be rising (if the Impulse Direction Filter is
enabled).
Short (Sell):
• A bearish RSI divergence appears (buying pressure fading);
• Within a short time window, the Impulse MACD turns strongly negative;
• Optionally, the impulse line must be falling (if the Impulse Direction Filter is enabled).
If momentum confirmation happens too late, the divergence “expires” and the signal is ignored.
________________________________________
🧩 How entries work
1. Reversal clue:
The strategy detects disagreement between price and RSI (price makes a new high/low, RSI doesn’t).
That suggests a shift in underlying strength.
2. Momentum confirmation:
Before entering, the Impulse MACD must agree — showing real push in the same direction.
3. Impulse direction filter (optional):
When enabled, the impulse itself must accelerate (rise for longs, fall for shorts), avoiding fake signals where price diverges but momentum is still fading.
4. No stacking:
It opens only one position at a time.
________________________________________
🚪 How exits work
Two main exit styles:
Conservative (default):
Longs close when impulse crosses below its signal line.
Shorts close when impulse crosses above its signal line.
✅ Keeps trades as long as momentum agrees.
Color-change (fast):
Longs close immediately when impulse flips bearish.
Shorts close immediately when impulse flips bullish.
⚡ Faster and more defensive.
Plus:
Stop Loss (%) and Take Profit (%) act as fixed-distance protective exits (set to 0 to disable either one).
________________________________________
📊 What you’ll see on the chart
A thick Impulse MACD line and thin signal line (oscillator view).
Diamonds — detected bullish/bearish divergence points.
Circles — where impulse crosses its signal (momentum change).
A performance panel (top-right) showing Net Profit, Trades, Win Rate, Profit Factor, Pessimistic PF, and Max Drawdown.
________________________________________
🔧 What you can tune
Signal Lifetime (bars): how long a divergence remains valid.
Impulse Direction Filter: ensure the impulse itself is moving in the trade’s direction.
Stop Loss / Take Profit (%): risk and target in percent.
Exit Style: conservative cross or faster color-change.
RSI / MA / Signal Lengths: adjust responsiveness (defaults are balanced).
________________________________________
💪 Strengths
Confirms reversals using momentum direction, not just divergence.
Avoids “early” signals where momentum is still fading.
Works symmetrically for longs and shorts.
Built-in stop/target protection.
Clear, visual confirmation of all logic components.
________________________________________
⚠️ Things to keep in mind
In sideways markets, the impulse can flip often — prefer conservative exits.
Too small SL/TP → constant stop-outs.
Too wide SL/TP → deep drawdowns.
Always test with different timeframes and markets.
________________________________________
💡 Practical tips
Start with default settings.
Enable “Use Impulse Direction Filter” in trending markets, disable it in very choppy ones.
Focus on Profit Factor, Win Rate, and Max Drawdown after several dozen trades.
Keep SL/TP roughly aligned with typical swing size.
“AlgoWay GRSIM” is a reversal-with-confirmation strategy: it spots likely turns, demands real momentum alignment (optionally verified by impulse direction), and manages exits with clear momentum cues plus built-in protective limits.

ALMASTO – Pro Trend & Momentum (v1.1)ALMASTO — Pro Trend & Momentum Strategy
Description:
This strategy is designed for precision trading in both Forex (FX) and Crypto markets.
It combines multi-timeframe trend confirmation (EMA200), momentum filters (RSI, MACD, ADX), and ATR-based dynamic risk management.
ALMASTO — Pro Trend & Momentum Strategy automatically manages take-profit levels, stop-loss, and breakeven adjustments once TP1 is reached — providing a structured and emotion-free trading approach.
Optimal Use
Works best on lower timeframes (5m–15m) with strong liquidity sessions.
Optimized for pairs like EURUSD, XAUUSD, and BTCUSDT.
Built for trend-following setups and momentum reversals with high volatility confirmation.
Recommended Settings
🔹 Forex – 5m
EMA Fast = 34, EMA Slow = 200, HTF = 1H
RSI (14): Long ≥ 55 / Short ≤ 45
MACD (8 / 21 / 5), ADX Len 10 / Min 27
ATR Len 7, Stop Loss = ATR × 2.1
TP1 = 1.1 RR, TP2 = 2.3 RR
Session = 07:00–11:00 & 12:30–16:00 (Exchange Time)
Risk = 0.8% per trade
🔹 Forex – 15m
EMA Fast = 50, EMA Slow = 200, HTF = 4H
RSI (14): Long ≥ 53 / Short ≤ 47
MACD (12 / 26 / 9), ADX Min 24
ATR Len 10, SL = ATR × 1.9
TP1 = 1.2 RR, TP2 = 2.6 RR
Risk = 1.0% per trade
🔹 Crypto – 5m (BTC/USDT)
EMA Fast = 34, EMA Slow = 200, HTF = 4H
RSI (14): Long ≥ 56 / Short ≤ 44
MACD (8 / 21 / 5), ADX Min 30
ATR Len 7, SL = ATR × 2.2
TP1 = 1.0 RR, TP2 = 2.5 RR
Session = 00:00–06:00 & 12:00–22:00 (UTC)
Risk = 0.5% per trade
Core Features
✅ Auto breakeven after TP1
✅ Dual take-profit system (1:1 & 1:2 RR)
✅ ATR-based stop & trailing logic
✅ Filters for session time, volume, and volatility
✅ Candle-body vs ATR size filter to avoid noise
✅ Optional cooldown between trades
Important Notes
Use bar close confirmation only (barstate.isconfirmed) to avoid repainting on lower timeframes.
Adjust commission (0.01–0.03%) and slippage (1–2 ticks) in Strategy Tester for realistic results.
Avoid low-liquidity hours (after 21:00 UTC for FX / after midnight for crypto).
Backtest using realistic broker data (e.g., BlackBull Markets / Bybit / Binance Futures).
Best results occur during London & New York sessions with moderate volatility.
⚠️ Disclaimer
This script is for educational and research purposes only.
It does not constitute financial advice.
Use proper risk management and test thoroughly before using on live accounts.
Developed by KING FX Labs
Built and optimized by Yousef Almasto — combining advanced price-action logic, multi-timeframe EMA structure, and volatility-adaptive ATR management.
Tested across Forex, Gold, and Crypto markets to ensure consistent performance and minimal drawdown.
📈 “Precision Trading. Zero Emotion. Pure Momentum.”

ORDER BLCOK custom strategy# OB Matrix Strategy - Documentation
**Version:** 1.0
**Author:** HPotter
**Date:** 31/07/2017
The **OB Matrix Strategy** is based on the identification of **bullish and bearish Order Blocks** and the management of conditional orders with multiple Take Profit (TP) and Stop Loss (SL) levels. It uses trend filters, ATR, and percentage-based risk management.
---
## 1. Main Parameters
### Strategy
- `initial_capital`: 50
- `default_qty_type`: percentage of capital
- `default_qty_value`: 10
### Money Management
- `rr_threshold`: minimum Risk/Reward threshold to open a trade
- `risk_percent`: percentage of capital to risk per trade (default 2%)
- `maxPendingBars`: maximum number of bars for a pending order
- `maxBarsOpen`: maximum number of bars for an open position
- `qty_tp1`, `qty_tp2`, `qty_tp3`: quantity percentages for multiple TPs
---
## 2. Order Block Identification
### Order Block Parameters
- `obLookback`: number of bars to identify an Order Block
- `obmode`: method to calculate the block (`Full` or `Breadth`)
- `obmiti`: method to determine block mitigation (`Close`, `Wick`, `Avg`)
- `obMaxBlocks`: maximum number of Order Blocks displayed
### Main Variables
- `bullBlocks`: array of bullish blocks
- `bearBlocks`: array of bearish blocks
- `last_bull_volume`, `last_bear_volume`: volume of the last block
- `dom_block`: dominant block type (Bullish/Bearish/None)
- `block_strength`: block strength (normalized volume)
- `price_distance`: distance between current price and nearest block
---
## 3. Visual Parameters
- `Width`: line thickness for swing high/low
- `amountOfBoxes`: block grid segments
- `showBorder`: show block borders
- `borderWidth`: width of block borders
- `showVolume`: display volume inside blocks
- `volumePosition`: vertical position of volume text
Customizable colors:
- `obHighVolumeColor`, `obLowVolumeColor`, `obBearHighVolumeColor`, `obBearLowVolumeColor`
- `obBullBorderColor`, `obBearBorderColor`
- `obBullFillColor`, `obBearFillColor`
- `volumeTextColor`
---
## 4. Screener Table
- `showScreener`: display the screener table
- `tablePosition`: table position (`Top Left`, `Top Right`, `Bottom Left`, `Bottom Right`)
- `tableSize`: table size (`Small`, `Normal`, `Large`)
The table shows:
- Symbol, Timeframe
- Type and status of Order Block
- Number of retests
- Bullish and bearish volumes
---
## 5. Trend Filters
- EMA as a trend filter (`emaPeriod`, default 223)
- `bullishTrend` if close > EMA
- `bearishTrend` if close < EMA
---
## 6. ATR and Swing Points
- ATR calculated with a customizable period (`atrLength`)
- Swing High/Low for SL/TP calculation
- `f_getSwingTargets` function to calculate SL and TP based on direction
---
## 7. Trade Logic
### Buy Limit on Bullish OB
- Conditions:
- New bullish block
- Uptrend
- RR > threshold (`rr_threshold`)
- SL: `bullishOBPrice * (1 - atr * atrMultiplier)`
- Multiple TPs: TP1 (50%), TP2 (80%), TP3 (100% max)
- Quantity calculation based on percentage risk
### Sell Limit on Bearish OB
- Conditions:
- New bearish block
- Downtrend
- RR > threshold (`rr_threshold`)
- SL: `bearishOBPrice * (1 + atr * atrMultiplier)`
- Multiple TPs: TP1 (50%), TP2 (80%), TP3 (100% max)
- Quantity calculation based on percentage risk
---
## 8. Order Management and Timeout
- Close pending orders after `maxPendingBars` bars
- Close open positions after `maxBarsOpen` bars
- Label management for open orders
---
## 9. Alert Conditions
- `bull_touch`: price inside maximum bullish volume zone
- `bear_touch`: price inside maximum bearish volume zone
- `bull_reject`: confirmation of bullish zone rejection
- `bear_reject`: confirmation of bearish zone rejection
- `new_bull`: new bullish block
- `new_bear`: new bearish block
---
## 10. Level Calculation
- Swing levels based on selected timeframe (`SelectPeriod`)
- `xHigh` and `xLow` for S1 and R1 calculation
- Levels plotted on chart
---
## 11. Take Profit / Stop Loss
- Extended horizontal lines (`extendBars`) to visualize TP and SL
- Customizable colors (`tpColor`, `slColor`)
---
## 12. Notes
- Complete script based on Pine Script v5
- Advanced graphical management with boxes, lines, labels
- Dynamically displays volumes and Order Blocks
- Integrated internal screener
---
### End of Documentation

SabinaCounter-trend strategy working only in long.
Principle of Operation
The strategy is based on market extremes, which serve as both the signals for opening a position and for closing it. These extremes possess data such as Open, High, Low, Close, and others. The length and the shift (positive or negative) of the extremes are also configurable.
The extreme Ext is used for closing the position, and the extreme Ent is used for opening the position.
Base Order
A dedicated percentage of the deposit is specified. If the price crosses the Ent extreme, a long position is opened.
Take Profit and Stop Loss
The Take Profit level is calculated from the average price. A trailing stop order is present by default, which is set by the Ext extreme. When the price crosses this extreme, the position will be closed if the Take Profit has not yet been reached.
Grid of Orders (Averaging)
This section allows for enabling or disabling the grid of orders.
In the order grid, you can specify the percentage below the base order at which the grid's limit orders should be placed. The grid step is also configurable. The leverage for all orders, including the base order, is set here.
The order grid consists of 10 orders, and each order can be assigned its own percentage of the deposit. This gives the strategy greater flexibility compared to a standard DCA (Dollar-Cost Averaging) grid.
Information Panel
A table displays the historical price drop at a given moment, providing some insight into the potential liquidation level based on the selected leverage. The table also shows the deposit utilization (how much of the deposit is currently tied up).

三均線中頻策略 v3.0 - R=2.5 + 進場點點標記📌 Core Strategy Concept
This is a medium-frequency trend-following model that utilizes three Simple Moving Averages to determine bullish or bearish alignment. It then enters trades in the direction of the trend when price confirms a breakout and applies a fixed risk-to-reward ratio (R). Stop loss and take profit levels are dynamically calculated based on moving averages, ensuring clear risk control and systematic execution.
✅ Strategy Advantages
📏 Clear Rules Trade conditions based on triple SMA alignment and price breakout; easy to replicate.
🛡 Defined Risk Stop loss and take profit are calculated based on moving averages with a fixed R ratio, ensuring disciplined risk management.
⚖️ Balanced Frequency Medium trade frequency avoids overtrading while still capturing sufficient opportunities.
👁 Visual Markers Entry points are visually marked on the chart for easy backtesting and live tracking.
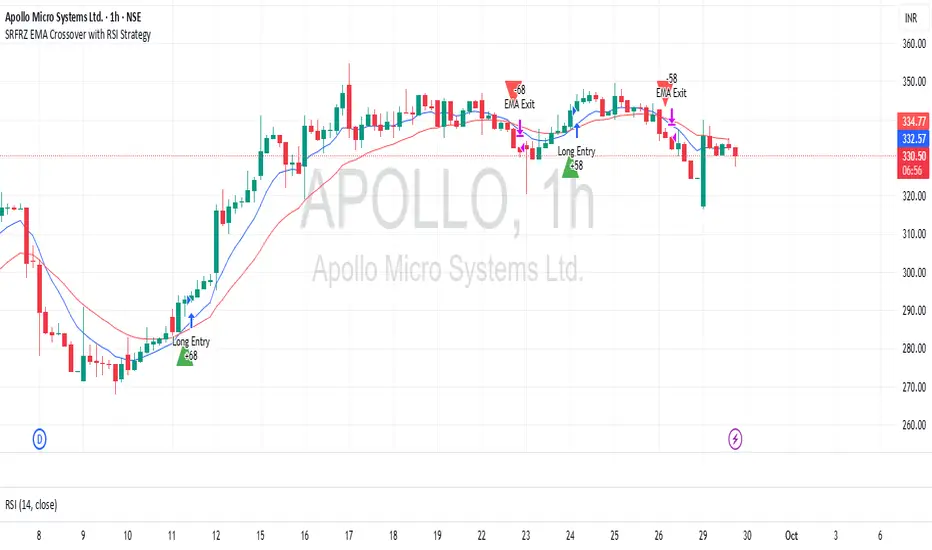
SRFRZ EMA Crossover with RSI StrategySRFRZ EMA Crossover with RSI Strategy
1. Overview
Strategy Name: SRFRZ EMA Crossover with RSI Strategy
Summary: A trend-following strategy designed for Indian stock and index markets, operating on any timeframe (optimized for 1H or 4H charts). It combines a 9-period and 21-period EMA crossover with RSI confirmation to identify high-probability long entries during the Indian trading session (9:15 AM–3:25 PM IST). Backtested with a fixed 20% capital allocation per trade, 3% stop loss, and 50% take profit, it aims for consistent returns in trending markets.
Intended Audience: Intermediate traders familiar with EMA and RSI, seeking automated signals for Indian markets.
2. How It Works (Core Logic)
Entry Conditions (Long/Buy Signal):
Primary Trigger: A "Golden Cross" occurs when the 9-period EMA crosses above the 21-period EMA, signaling bullish momentum.
RSI Confirmation: RSI (14-period) must be above 55, or cross above 55, to confirm strong momentum.
Trend Filter: The 9-period EMA must remain above the 21-period EMA for delayed RSI-triggered entries.
Session Filter: Trades are only executed during the Indian market session (9:15 AM–3:25 PM IST, Monday–Friday).
Exit Conditions:
Take Profit (TP): Fixed at 50% above the entry price (e.g., entry at ₹100, TP at ₹150).
Stop Loss (SL): Fixed at 3% below the entry price (e.g., entry at ₹100, SL at ₹97).
Indicator-Based Exit: Close the position if a "Death Cross" occurs (21-period EMA crosses above 9-period EMA).
Position Sizing: Allocates 20% of initial capital (₹100,000 default) per trade, calculated as (initial_capital * 0.20) / entry_price.
3. Key Indicators & Parameters
Primary Indicators:
EMA (9-period): Fast-moving average to capture short-term trends (plotted in blue).
EMA (21-period): Slower-moving average for trend confirmation (plotted in red).
RSI (14-period): Measures momentum, with a threshold of 55 for bullish confirmation (plotted in purple).
Customizable Settings in Pine Script:
initial_capital: Default ₹100,000 (adjust based on your account size).
qty_percent: Default 20% of capital per trade (adjust for risk tolerance).
sl_percent: Default 3% stop loss (adjust for volatility).
tp_percent: Default 50% take profit (adjust for reward targets).
session_time: Default "0915-1525:1234567" (Indian session, adjustable for other markets).
Default Values: Optimized for Indian stocks/indices (e.g., NIFTY 50) on 1H or 4H charts.
Risk Management:
Always use the built-in 3% stop loss.
Avoid trading during major news events (e.g., RBI announcements), as Pine Script cannot filter these.
Risk only 20% of capital per trade to diversify exposure.
Pro Tips:
Combine with support/resistance levels for manual confirmation.
Test on a demo account to validate performance on your chosen asset.
Monitor RSI for overbought conditions (>70) to anticipate reversals.
4. Visuals on Chart
Plotted Indicators:
Blue line: 9-period EMA.
Red line: 21-period EMA.
Purple line: RSI (14-period) in a separate pane.
Trade Signals:
Green triangle (below bar): Long entry.
Red triangle (above bar): Long exit (via TP, SL, or Death Cross).
5. Disclaimer & Notes
Risk Warning: Past performance is not indicative of future results. Trading involves significant risk. This strategy is for educational purposes only and is not financial advice.
Customization: The script is open-source (modify freely). Fork it to add short-selling logic or additional filters.
Note: The strategy avoids trades during non-session hours but cannot filter news events. Manually check economic calendars.
Add the script to your chart and adjust inputs (e.g., capital, TP/SL percentages).
Enable alerts for "Long Entry" and "Long Exit TP/SL" or "EMA Exit" to automate signals.
Optionally, connect to a broker via webhooks for auto-trading (consult your broker’s API).
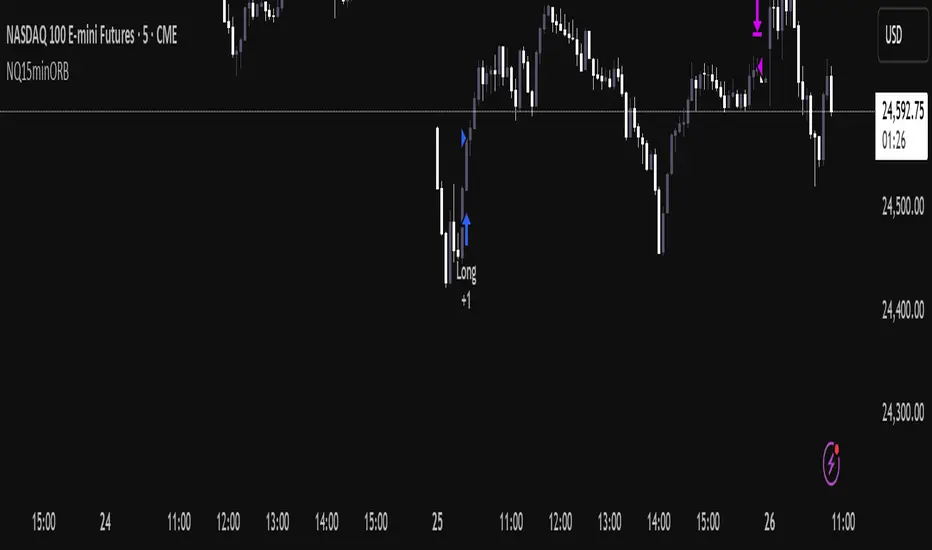
NQ Opening Range BreakoutOpening Range Breakout script with:
Customizable opening range timeframe selection.
Inputs for Risk to Reward ratio, EMAs, Vwap, and ATR sizing to avoid ranges that are too big or too small.
Features a toggle for reversal trades that when enabled will trade the other direction if the initial ORB gets stopped out.
Default it will use the entire opening range to determine stop loss and take profit and if neither the take profit or stop loss is hit it will end the trade at 16:00. There are toggles to use half the opening range as the stop loss and take profit will then be calculated as risk reward ratio * stop loss or you can select entry candle stop loss and risk reward ratio which places the stop loss at the entry candles opening price. There is also a take profit option that will only exit the trade when price closes below (for longs) or above (for shorts) a customizable ema length.
Note that if you have the opening range, for example, selected as 9:30 - 9:45 and are on a 5 minute chart it will enter on the first 5 min closure outside of that range and if you are on a 15 minute chart it will enter on the first 15 min closure outside of that range and so on.
You can automate the entries and exits by using a webhook service and using the strategy’s alerts.
EMA CROSS STRATEGY MAXTRA ENTRY LOGIC
Long Entry (Buy Signal):
Condition: Short EMA crosses above Long EMA (Golden Cross)
Interpretation: A potential upward trend is beginning
Short Entry (Sell Signal):
Condition: Short EMA crosses below Long EMA (Death Cross)
Interpretation: A potential downward trend is beginning
EXIT LOGIC
There are a few options depending on the style of strategy:
Option 1: Opposite Crossover
Exit Long: When Short EMA crosses below Long EMA
Exit Short: When Short EMA crosses above Long EMA
This method keeps you in the trade until the trend reverses.
Option 2: Fixed Stop Loss / Take Profit
Exit trade when a profit target or stop loss is hit
Example: 2% stop loss and 4% take profit
Note : In Properties, go to Initial Margin. Add one more zero to get the backtest results for futures trades. For spot, use it as it is.

Pivot SuperTrend Auto-Opt + WFO + MultiObj + Filter/Diag# Pivot SuperTrend (NetProfit Auto-Optimization) — Summary & Quick Start
## What this strategy is
A self-optimizing **SuperTrend-style** strategy for TradingView Pine v6 that:
- builds a **walk-forward, net-profit optimizer** directly on the chart,
- adapts its trailing stop/entry logic to **market regime** and **volatility**, and
- exposes a **filter/gate suite** so you can dial aggressiveness vs. noise without breaking auto-optimization.
Default tuning: **Bybit ETHUSDT Perpetual, 30m** (works elsewhere once tuned).
---
## Core logic (high level)
### 1) SuperTrend backbone (with Center/Pivots)
- **Center line**: smoothed running pivot from `ta.pivothigh/low`.
- **SuperTrend bands**: `Center ± Factor × ATR(length)` with a carry rule to reduce whipsaws.
- **Trend state**: `+1` above band, `-1` below band.
- **Flip**: trend change; can require **1-bar confirmation**.
### 2) Adaptive smoothing (AMA of ST)
- Performance-weighted **alpha** smooths the trailing stop.
- Alpha clamped to `alpha_min…alpha_max` using optimizer’s fitness.
### 3) On-chart net-profit optimizer (walk-forward)
- Grid of parameters:
- ATR Length `len` (min…max…step)
- ATR Factor `F` (min…max…step)
- Performance memory `A` (min…max…step)
- Each grid point is paper-traded **each bar** including fees/slippage → **fitness = net profit EMA**.
- Every `opt_interval` bars the **best** candidate is activated (with hysteresis).
- Optional: apply only **ATR margin** gate inside the optimizer for speed/stability.
### 4) Regime detection & anti-chop
- Custom **ADX** + **Center slope** to classify **trend** vs **range**.
- Adaptive thresholds in range regime (distance-to-center, ST-near-center block, etc.).
- Optional **ATR fast/slow ratio** gate.
- Other tools: **min bars since flip**, **hold bars after flip**, **distance to center**, **ST near center** block.
### 5) Entry logic
- **Immediate on flip** or **1-bar confirm**.
- Must pass the **Filter Suite** (toggleable gates):
- ATR-margin cross (hard cross or wick reject)
- Trend Regime (require trend)
- Hold-after-flip
- Distance-to-center
- ST-near-center block
- Volatility ratio (ATR fast/slow)
- Min bars since flip (flip cooldown)
- Daily trade cap & post-loss cooldown
- Trading session window
### 6) Starter preset (failsafe)
- Lenient defaults so trades start quickly to build warm-up data; then you can tighten gates.
### 7) Position management
- Strategy entries for “LONG” / “SHORT”.
- Optional **50% take-profit on Center** (“usecenter”).
- **Only-Long** mode supported with separate exit logic if regime turns bearish.
### 8) Risk controls
- **Max trades per day**, **cooldown bars after loss**, **session window**.
- Optional **bar coloring**, **trend shading**, **signal markers**.
- **Diagnostics** labels show which gate blocked an entry (letters `M T H D N V F C CD S`).
### 9) Alerts & Bybit webhook
- Use alert condition: **Any alert() function call**.
- Fires `"LONG_CONFIRMED"` / `"SHORT_CONFIRMED"`.
---
## Inputs overview
- **Pivot / Center**: pivot length; show pivots & center.
- **Visual**: line widths, bar colors, shading; warm-up bars.
- **Execution / Costs**: fee (bps), slippage (bps), “Only long”, 50% center-close.
- **Auto-Optimize**: grids for `len`, `F`, `A`, interval, memory, acceptance floor.
- **Signal Controls**: 1-bar confirm, ATR margin, min bars since flip.
- **Anti-Chop**: distance to center, hold bars, slope len, ST-near-center ATR, ATR slow len & ratio.
- **Trend Regime**: ADX len/threshold, center slope threshold, “require trend”.
- **Risk Gates**: max trades/day, loss cooldown bars.
- **Session**: optional 07:00–22:00 UTC filter.
- **Diagnostics**: show gate diagnostics labels.
- **Filter Suite**: toggle each gate; optional “apply margin to optimizer”.
- **Starter preset** selector.
---
## Plots & UI
- **Adaptive SuperTrend** (active candidate),
- **PP Center** (optional),
- **Trend shading** (price vs ST zone),
- **Entry/Exit markers** (triangles),
- **Diagnostics** text labels (optional).
---
## Webhook notes (Bybit v5)
If you use a direct Bybit webhook:
- **Symbol**: TradingView may emit `ETHUSDT.P`. Bybit wants `ETHUSDT`. Your relay should **strip `.P`**.
- **Side**: TV provides `buy/sell`. Bybit expects `Buy/Sell` → normalize casing in the relay.
- **Reduce-only**: mark exits and partial closes reduce-only to avoid reversals in Hedge mode.
- **Market orders**: pass `"orderType":"Market"`; ignore price or set to `"marketPrice"` if your relay requires it.
**Entry (Market)**
```json
{
"exchange": "BYBIT",
"category": "linear",
"symbol": "{{ticker}}",
"side": "{{strategy.order.action}}",
"orderType": "Market",
"qty": "{{strategy.order.contracts}}",
"reduceOnly": false,
"timestamp": "{{timenow}}",
"clientOrderId": "pst_{{strategy.order.id}}_{{timenow}}"
}

Weekend Hunter Ultimate v6.2 Weekend Hunter Ultimate v6.2 - Automated Crypto Weekend Trading System
OVERVIEW:
Specialized trading strategy designed for cryptocurrency weekend markets (Saturday-Sunday) when institutional traders are typically offline and market dynamics differ significantly from weekdays. Optimized for 15-minute timeframe execution with multi-timeframe confluence analysis.
KEY FEATURES:
- Weekend-Only Trading: Automatically activates during configurable weekend hours
- Dynamic Leverage: 5-20x leverage adjusted based on market safety and signal confidence
- Multi-Timeframe Analysis: Combines 4H trend, 1H momentum, and 15M execution
- 10 Pre-configured Crypto Pairs: BTC, ETH, LINK, XRP, DOGE, SOL, AVAX, PEPE, TON, POL
- Position & Risk Management: Max 4 concurrent positions, -30% account protection
- Smart Trailing Stops: Protects profits when approaching targets
RISK MANAGEMENT:
- Maximum daily loss: 5% (configurable)
- Maximum weekend loss: 15% (configurable)
- Per-position risk: Capped at 120-156 USDT
- Emergency stops for flash crashes (8% moves)
- Consecutive loss protection (4 losses = pause)
TECHNICAL INDICATORS:
- CVD (Cumulative Volume Delta) divergence detection
- ATR-based dynamic stop loss and take profit
- RSI, MACD, Bollinger Bands confluence
- Volume surge confirmation (1.5x average)
- Weekend liquidity adjustments
INTEGRATION:
- Designed for Bybit Futures (0.075% taker fee)
- WunderTrading webhook compatibility via JSON alerts
- Minimum position size: 120 USDT (Bybit requirement)
- Initial capital: $500 recommended
TARGET METRICS:
- Win rate target: 65%
- Average win: 5.5%
- Average loss: 1.8%
- Risk-reward ratio: ~3:1
IMPORTANT DISCLAIMERS:
- Past performance does not guarantee future results
- Leveraged trading carries substantial risk of loss
- Weekend crypto markets have 13% of normal liquidity
- Not suitable for traders who cannot afford to lose their entire investment
- Requires continuous monitoring and adjustment
USAGE:
1. Apply to 15-minute charts only
2. Configure weekend hours for your timezone
3. Set up webhook alerts for automation
4. Monitor performance table in top-right corner
5. Adjust parameters based on your risk tolerance
This is an experimental strategy for educational purposes. Always test with small amounts first and never invest more than you can afford to lose completely.
